Monitor Your Team's Performance
Your Coaching Portal dashboard shows you everything about your team's learning and development at a glance. It's where you'll spot trends, identify coaching opportunities, and track how your team is progressing.
Team leads want to see how their team is performing at a glance. Your Dashboard gives you the tools to monitor trends, spot coaching opportunities, and track how your team is developing.
What is Your Dashboard? Your Dashboard is your performance monitoring hub, metrics, trend analysis, coaching insights, and team development tracking to help you make informed decisions about your team's growth.
What You Can Achieve
- Spot learning gaps early and take action before they affect performance
- Track progress trends to see how individuals and teams are improving
- Identify top performers and recognise excellence with confidence
- Pinpoint development needs to deliver targeted coaching
- Understand Key Performance Areas by monitoring how well your team performs in crucial evaluation categories like Customer Care and Compliance
- Improve training efficiency by focusing on what drives measurable results
Understanding Your Dashboard
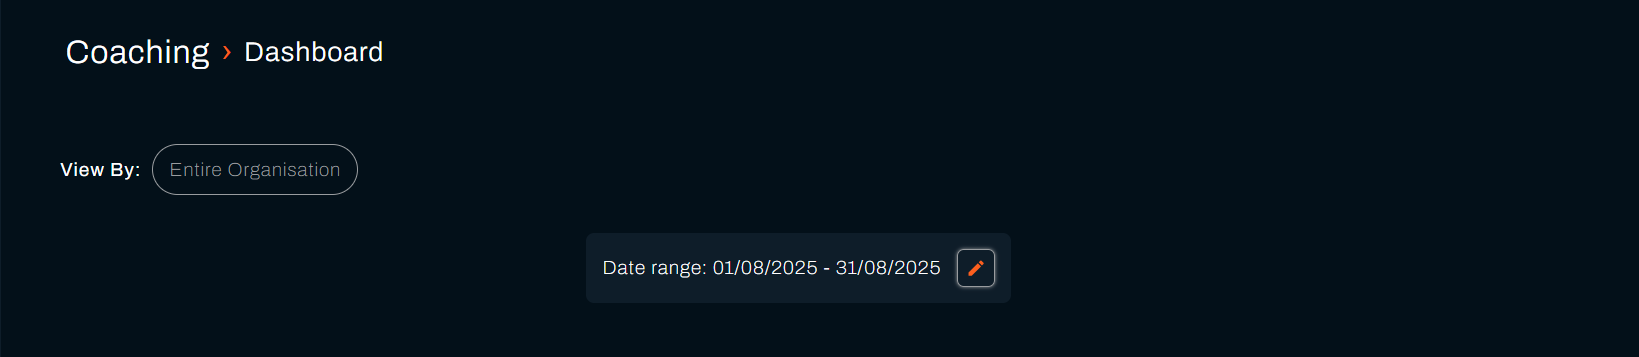
Date Range Selection
Use the Date Range filter at the top of the dashboard to analyse performance over specific time periods:
💡 Tip: Use different date ranges to spot trends - weekly views show immediate issues, while monthly views reveal longer-term patterns.
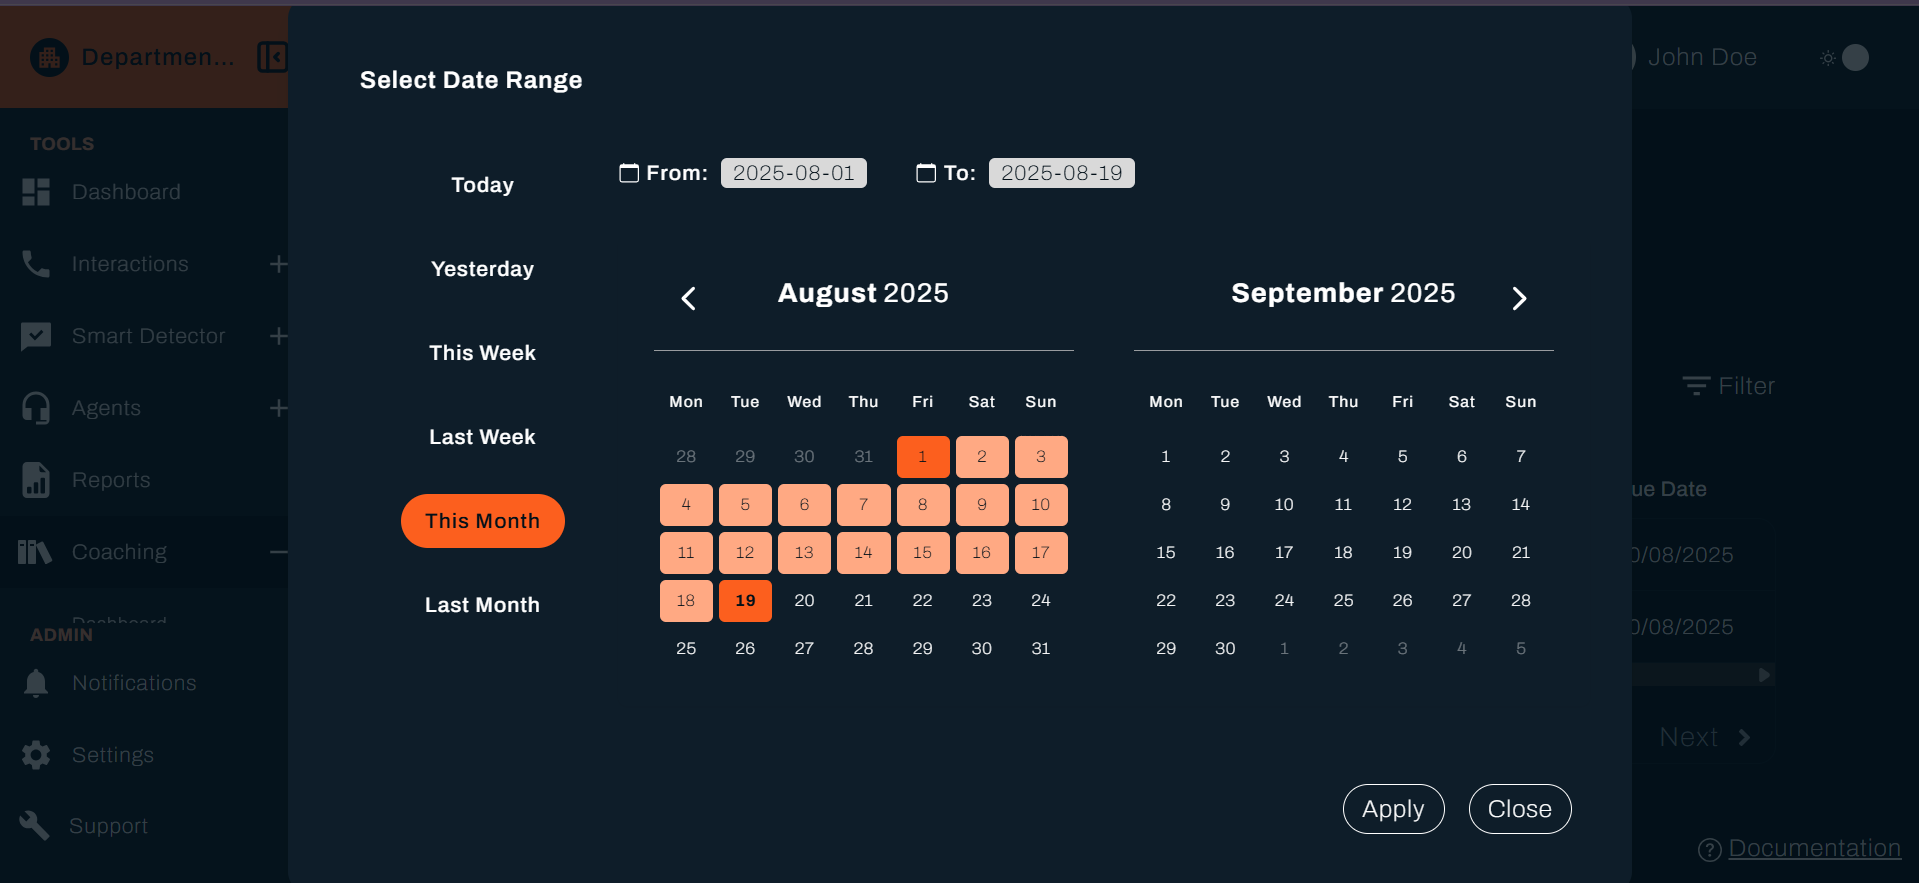
- Custom Date Range: Select start and end dates to focus on specific periods
- Quick Filters: Choose from preset options like "Last week", "Last month"
- Live Updates: All metrics automatically update when you change the date range
Custom Date Range Filter (continued)
Category Scores
Your dashboard shows performance metrics across different evaluation categories. The specific categories you see will depend on how your company has set up the system.
Common categories include:
Customer Care – How well agents handle customer interactions (e.g., average score, performance variation, trends)
Compliance – Adherence to company policies, regulatory standards, and documentation accuracy
Auto Fails
Auto Fails represent critical errors that automatically fail an evaluation. This percentage shows what portion of calls had at least one auto-fail criterion.
Why this matters: Auto-fail trends help you identify critical issues that need immediate attention and training.
Understanding Auto Fail Metrics
- Percentage Display: Shows the proportion of interactions with auto-fail occurrences
- Trend Tracking: Monitor whether auto-fail rates are increasing or decreasing
- Team vs Individual: Compare team average with individual agent performance
Performance Charts
Access detailed performance analytics through expandable chart sections that provide deeper insights into team performance trends.
💡 Pro Tip: Use the drill-down features to identify specific agents or time periods that need attention.
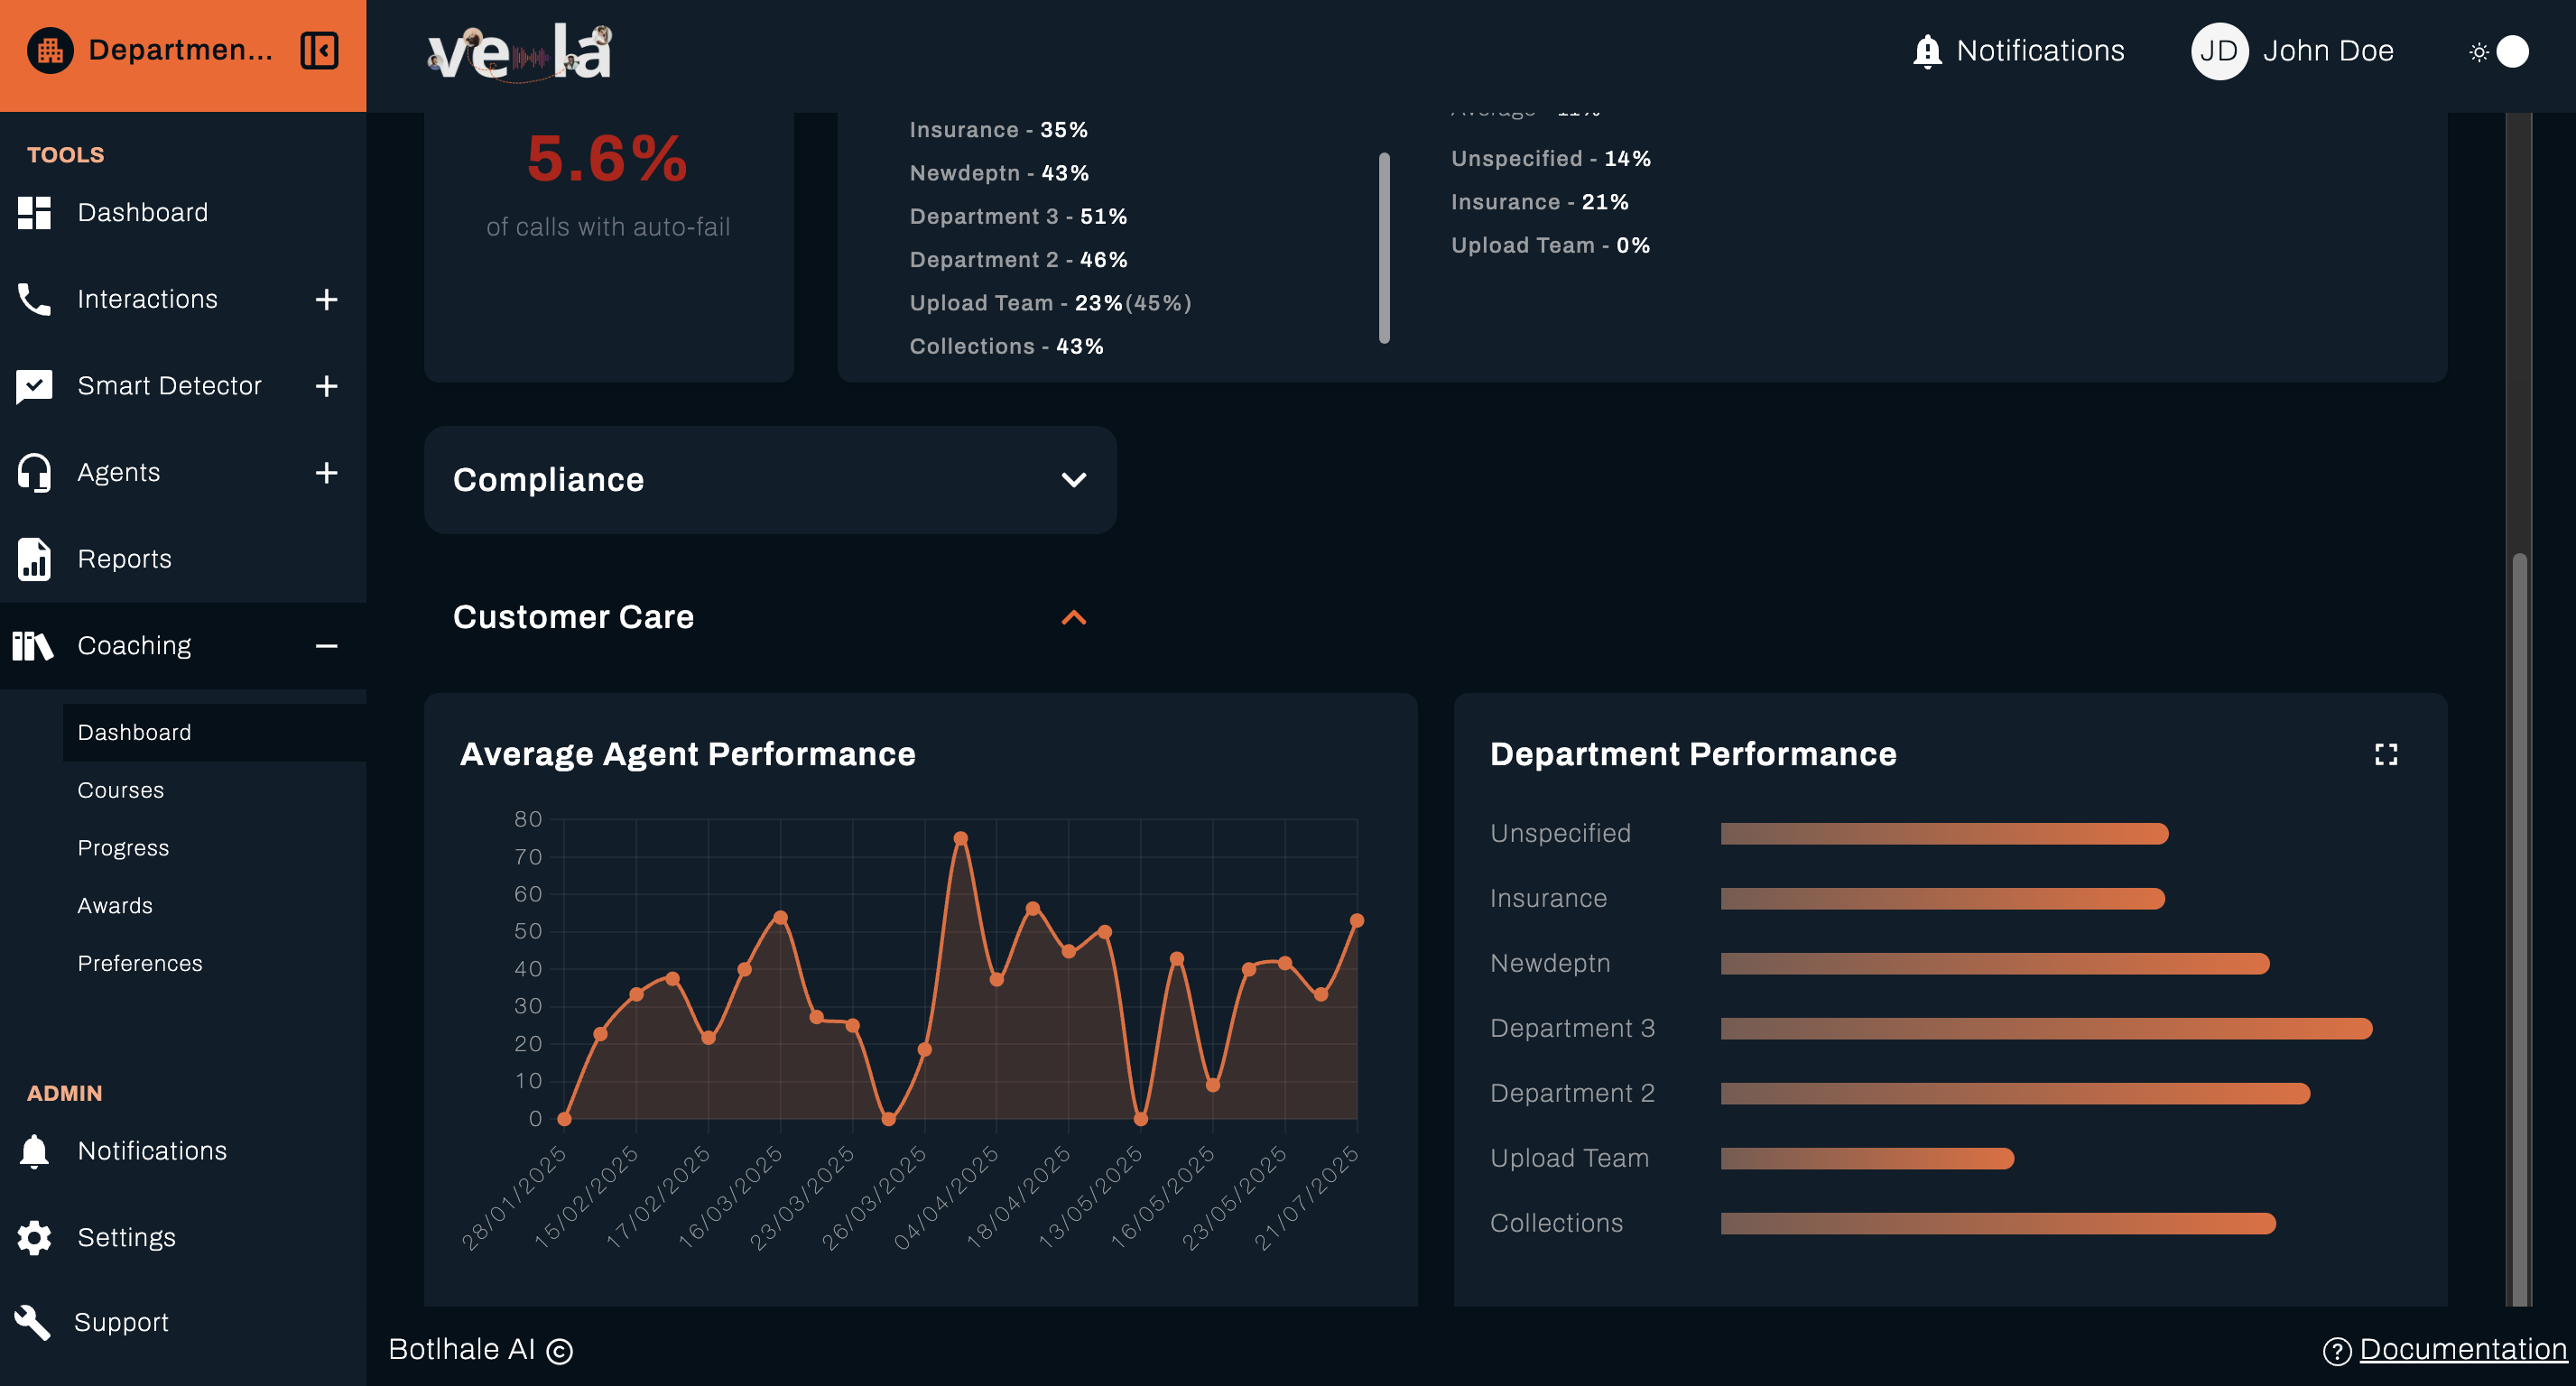
Chart Sections
The dashboard includes several accordion-style chart sections:
Average Agent Performance
Left Panel: Displays average agent performance on a category
Overall Performance Analysis
Right Panel: Shows aggregate performance data based on your selected scope on a category
Scope Options:
- Team Performance: Metrics for your specific team
- Department Performance: Broader departmental view including multiple teams
- Agent Department: Cross-departmental agent performance comparison
Interactive Features
Drill-Down Capabilities
- Click on Data Points: Access detailed breakdowns of specific metrics
- Zoom In or Resize: Ability to resize charts to drill down and view data accurately
What's Next?
Now that you understand your dashboard, explore these related guides:
- 📊 Monitor Progress - Track learning completion and trends
- 📚 Manage Courses - Create and assign training materials
- 🏆 Recognise Achievements - Set up awards and recognition
- 📞 Review Interactions - Analyse agent performance
Need Help?
Stuck with your dashboard? We're here to help!
- 📖 Progress Tracking Guide - Learn about detailed progress monitoring
- 📖 Course Management Guide - Understand course creation and assignment
- 📖 Awards System Guide - Set up recognition programmes
Still need assistance?
- Email us: support@botlhale.ai
Was This Guide Helpful?
We're constantly improving our documentation. Let us know how we can make this guide better for you and your team.
Improve Team Success: Regular dashboard monitoring combined with targeted coaching interventions leads to sustained performance improvements. Use the insights to guide your team toward excellence.hile maintaining focus on both individual growth and team objectives.